 how-to
How to Calculate Total Cost of Ownership for Drive Belts
Last Updated: October 31, 2026
Quick Summary
Calculating total cost of ownership for drive belts means adding up every dollar those drive belts cost from installation to retirement. Purchase price is one line; maintenance, downtime, energy, and labor are the rest, and the formula is TCO = Purchase + Installation + Planned Maintenance + Unplanned Repair + Downtime + Energy + Inventory - Salvage.
- A complete drive belt ownership model has eight cost inputs, and missing any one makes your number too low.
- Set a realistic ownership period of one to three years and use logged runtime, not nameplate hours.
- Divide total cost of ownership by total operating hours to compare belts on equal footing.
- Downtime cost equals lost output per hour multiplied by the hours the drive is down.
- Planned replacement on a scheduled shutdown is almost always cheaper than an unplanned failure.
Table of Contents
- Why Purchase Price Is the Smallest Line in Your Drive Belt Budget
- Setting Your Ownership Period and Usage Assumptions
- The Drive Belt TCO Formula, With a Worked Example
- How to Run a Cost per Operating Hour Calculation
- Industrial Belt Replacement Cost: Parts, Labor, and Downtime
- Equipment Downtime Cost Calculation for Belt Failures
- Preventive Maintenance Cost Analysis: What Planned Replacement Saves
- Where Belt Materials and Drive Technology Change the Math
- Frequently Asked Questions
Why Purchase Price Is the Smallest Line in Your Drive Belt Budget
Most maintenance managers track what a belt costs to buy. Few track what it costs to own.
Calculating total cost of ownership for drive belts means adding up every dollar those drive belts cost from installation to retirement.
A belt that costs less up front but fails twice as often is not cheaper.
Below, we walk through an eight-category model, a working formula, and a cost-per-hour method you can run on your own drives.
The Eight Cost Categories That Belong in Every TCO Model
A complete drive belt ownership model has eight inputs. Miss any one and your number is too low.
- Purchase price: the belt itself, plus freight
- Installation labor: technician time to fit and tension it
- Planned maintenance: inspections, re-tensioning, alignment checks
Most spreadsheets stop at line one. That is the mistake.
Setting Your Ownership Period and Usage Assumptions
Every TCO number depends on two choices: how long you own the belt and how hard you run it.
Start with a realistic ownership period. For most industrial drives, that is one to three years, or the full service life of the belt, whichever comes first.
Write these down before you touch a calculator:
- Ownership period in years
- Operating hours per year
- Number of belts per drive
These four numbers drive everything else. Use actual logged runtime, not nameplate hours, check your maintenance records, not the spec sheet.
The Drive Belt TCO Formula, With a Worked Example
Here is the formula we recommend. It is simple enough to audit and complete enough to trust.
TCO = Purchase + Installation + Planned Maintenance + Unplanned Repair + Downtime + Energy + Inventory - Salvage
That single line is the summary.
| Cost term | What it includes | Typical data source |
|---|---|---|
| Purchase | Belt price plus inbound freight | Supplier invoice |
| Installation | Technician hours × loaded labor rate, plus any tensioner or pulley work | Work order |
| Planned maintenance | Inspection, re-tensioning, alignment checks at scheduled intervals | PM schedule and labor log |
| Unplanned repair | Emergency labor, expedited freight, collateral damage | Maintenance history |
| Downtime | Lost output per hour × hours down × failure frequency | Production records |
| Energy | Drive power draw × operating hours × energy rate | Meter data or nameplate estimate |
| Inventory | Carrying cost on spares (typically a small percentage of spare value per year) | Storeroom records |
| Salvage | Documented scrap or resale value; usually zero for used belts | Scrap receipt |
Now a worked example. Say a drive runs one belt, 2,000 hours a year, over a two-year ownership period.
- Purchase: $40
- Installation labor: $60
- Planned maintenance: $50
Total: $790. Purchase price is just 5% of that; downtime and repair lines dwarf it.
Building the Inputs: A Practical Data-Collection Worksheet
Before you trust any TCO number, gather the inputs from records rather than guesses. A simple worksheet with these fields keeps the model honest:
- Supplier data: belt price, freight terms, minimum order quantity, lead time for standard and expedited delivery
- Maintenance data: logged runtime hours per year, inspection interval, average labor hours per replacement, loaded labor rate
- Operating data: lost output value per hour of downtime, typical hours down per failure, failure frequency from maintenance history
Pull runtime from maintenance logs, not nameplate hours. Pull failure frequency from work-order history over at least two replacement cycles. Where records are missing, mark the input as an assumption and flag it for sensitivity testing.
Testing How Uncertain Assumptions Change the Result
A TCO model is only as good as its weakest input.
For the example above, if downtime cost per hour doubles, the downtime line rises from $300 to $600 and total TCO climbs to about $1,090.
If the ranking between two belt options holds across most of the plausible range, the decision is robust. When the ranking flips inside the range, you need better data before you commit.
Plugging in Service Life, Replacement Interval, and Resale Value
Service life sets how often you repeat the repair and downtime costs. A belt rated for 5,000 hours on a 2,000-hour drive lasts about two and a half years.
For realistic replacement intervals to plug into this model, see our industrial belt replacement frequency guide.
Resale or salvage value is usually near zero for used belts. Set it to zero unless you have a documented scrap value. Honest zero beats an optimistic guess.
How to Run a Cost per Operating Hour Calculation
Cost per operating hour turns TCO into a number you can compare across drives. The math is one division.
Cost per operating hour = Total Cost of Ownership ÷ Total Operating Hours
Using the example above: $790 ÷ 4,000 hours = about $0.20 per operating hour.
Now compare two belts. Belt A costs $40 and lasts 5,000 hours. Belt B costs $25 and lasts 2,500 hours.
This is the single most useful metric for procurement.
Industrial Belt Replacement Cost: Parts, Labor, and Downtime
Industrial belt replacement cost has three parts, and the belt is the smallest. Parts are the belt and any pulley or tensioner work. Labor is technician time, which varies with access and drive size. Downtime is the production you lose while the drive is stopped.

Watch out: hard-to-reach drives take far longer to service, and that labor premium rarely shows up in a purchase-price comparison. Factor access into your labor estimate or you will undercount every replacement.
To understand what drives the parts line before you size it, read our breakdown of the factors behind industrial belt wholesale pricing.
Equipment Downtime Cost Calculation for Belt Failures
Downtime is the biggest number most buyers ignore. To calculate it, multiply lost output per hour by the hours the drive is down.
Downtime cost = Lost output per hour × Hours down
A line producing $500 of output per hour that sits idle for four hours loses $2,000. One belt failure can wipe out the savings of dozens of cheaper belts.
Failure frequency matters as much as severity. Our guide to why industrial belts fail prematurely covers the root causes so you can estimate how often a failure is likely.
Two failure modes drive most of the cost:
- Sudden failure: no warning, full downtime hit
- Gradual wear: slipping and squealing, lower output, easy to catch early
Catching gradual wear early is where preventive maintenance pays for itself.
Preventive Maintenance Cost Analysis: What Planned Replacement Saves
Preventive maintenance cost analysis compares what you spend on planned service against what unplanned failures cost you. Planned replacement is almost always cheaper.
A planned belt swap happens on a scheduled shutdown with the right part on the shelf.
Build a simple maintenance program:
- Inspect belts on a fixed interval
- Log tension and alignment at each check
- Replace on condition or hours, not on failure
For a full program you can copy, see our guide on how to maintain industrial drives. The point is to move replacement from reactive to scheduled.
Where Belt Materials and Drive Technology Change the Math
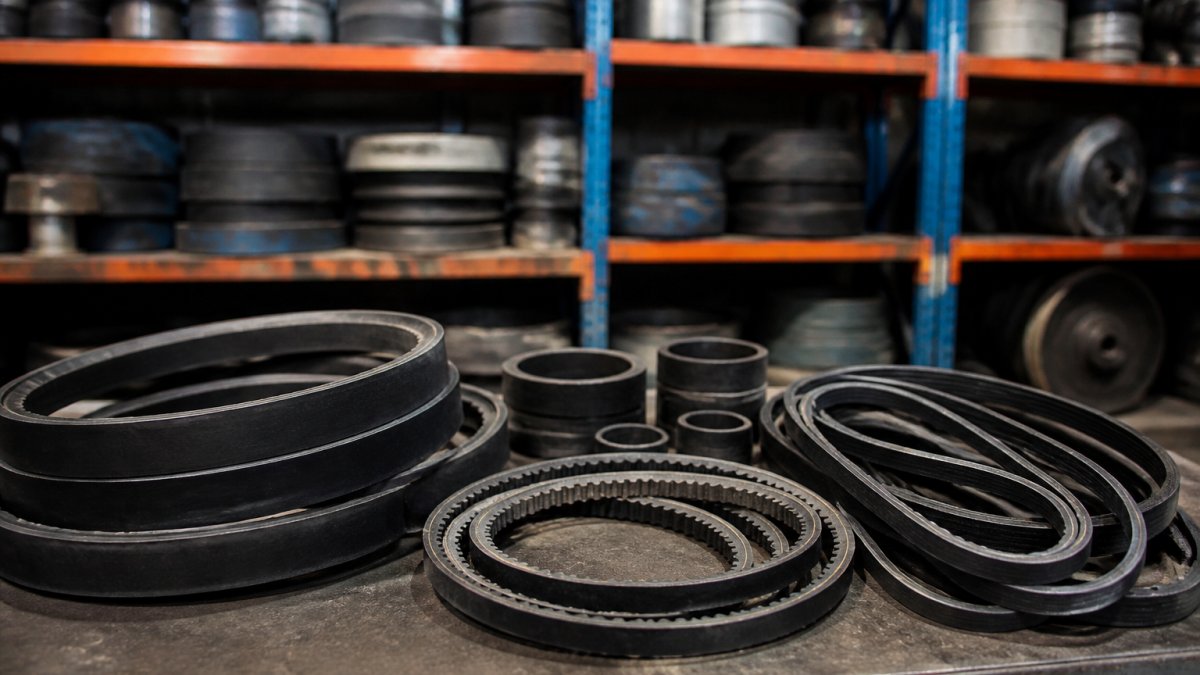
Material and drive type change every input in the model. A cogged belt runs cooler and grips better on small pulleys. A banded belt keeps multiple belts from whipping.
This is why a TCO comparison across materials is worth the effort.
To understand how material choice feeds into service life and cost, read our guide on choosing the right industrial belt material.
Comparing Belt Constructions Under Matched Conditions
A fair comparison holds the drive fixed, same pulley diameters, center distance, speed ratio, and operating hours, and changes only the belt construction. Then you can attribute differences in TCO to the belt itself rather than to the drive design.
| Construction | Lifecycle effect to test | Where it usually shows up in the model |
|---|---|---|
| Cogged | Runs cooler on small pulleys; can extend service life where heat is the limiting factor | Planned maintenance and replacement frequency |
| Banded | Reduces whip and misalignment on multi-belt drives; can lower failure frequency | Unplanned repair and downtime |
| Raw-edge wedge | Carries more load in less space; may allow a narrower drive or longer life at the same load | Purchase price versus service life trade-off |
| Standard wrapped | Lower purchase price; often shorter life under heat or shock loads | Purchase price versus replacement cycles |
For each option, plug the same labor rate, downtime cost per hour, and energy rate into the model. The option with the lowest cost per operating hour wins, even if its purchase price is higher.
How Alternative Drive Technologies Change the TCO
Belts are not the only way to transmit power. Chains and direct drives change the cost structure in ways a belt-only comparison misses.
- Chain drives typically tolerate higher temperatures and shock loads but need lubrication, periodic tension adjustment, and have their own wear and elongation pattern. The maintenance line rises; the purchase line may fall.
- Direct drives (motor coupled directly to the load) eliminate the belt entirely, removing belt purchase, tensioning, and replacement labor, but change motor and control cost and can reduce flexibility in speed and layout.
The right comparison is not belt versus belt in isolation. It is the full ownership cost of each transmission option over the same analysis period, using the same downtime and energy assumptions. When a belt drive is the incumbent, the alternative has to beat the belt's total TCO, not just its purchase price.
The Engineering Inputs That Set the Baseline
Engineering inputs matter too: pulley diameter, belt length, center distance, speed ratio, and wrap angle all affect how hard the belt works. A well-designed drive runs cooler and lasts longer; a tight wrap angle or misaligned pulleys wears belts fast.
Model the current drive first, then model the same drive with corrected geometry, larger pulleys, better alignment, proper tension, and compare the two TCO results. The geometry fix often pays back through longer service life and fewer failures, and the model shows exactly how much.
The takeaway is simple. Price the belt by what it does over its whole life, not what it costs on the invoice.
Frequently Asked Questions
What costs should be included in the total cost of ownership for a drive belt?
A complete model covers the purchase price, installation labor, expected service life and replacement interval, routine tension checks and pulley alignment, energy losses from slip and belt flex, unplanned downtime, and any salvage or resale value at the end of the ownership period. Insurance and financing apply mainly to large drive assemblies rather than the belt itself. Leaving out downtime and energy is the most common reason a cheap belt looks cheaper than it is.
How do you calculate the cost per operating hour of a drive belt?
Add total lifetime costs (belt price, labor, energy, downtime risk, and maintenance) and divide by total operating hours over the ownership period. For example, a drive running 4,000 hours a year for five years gives 20,000 operating hours. If lifetime cost is $2,400, the cost per operating hour is $0.12. Running the same math on a lower-priced belt with a shorter replacement interval often shows a higher hourly figure.
Should downtime be included when comparing drive belt costs?
Yes. Unplanned failures stop production, and that lost output usually dwarfs the belt price. Estimate downtime cost by multiplying lost output per hour by the hours a replacement takes, including diagnosis, parts wait, and restart. A belt that fails half as often can justify a higher purchase price even when the sticker cost is double. Track actual stoppage hours so the estimate reflects your plant, not a generic figure.
How can preventive maintenance reduce drive belt ownership costs?
Scheduled tension checks, pulley alignment, and replacement before failure convert unpredictable breakdowns into planned work that fits around production. Planned swaps also avoid expedited shipping and overtime labor. A preventive maintenance cost analysis compares the annual cost of inspections and planned belt changes against the expected cost of failures, and in most drives the planned route wins once downtime is priced in.